This pages compiles resources sections for CMI instruments. See instrument pages in the Technologies Section for more details on specific instruments.
CMI Instrument Resources
CMI Flyers
CMI Technologies
SPR at the CMI
Surface Plasmon Resonance (SPR) is an optical technique used to measure molecular interactions in real time. SPR can occur when plane-polarized light hits a metal film under total internal reflection conditions. SPR signal is directly dependent on the refractive index of the medium on the sensor chip. The binding of biomolecules results in changes in the refractive index on the sensor surface. In an SPR experiment, one molecule (the Ligand) is immobilized on a sensor chip and binding to a second molecule (the Analyte) is measured under flow. Response is measured in resonance units (RU) and is proportional to the mass on the surface, and for any given interactant, the response is proportional to the number of molecules bound to the surface. Response is recorded and displayed as a sensogram in real time. SPR experiments can be used to measure kinetic binding constants (ka, kd) and equilibrium binding constants (affinity, Ka = 1/Kd).


The CMI has a Biacore T200 from Cytiva, formerly GE Life Sciences.
BLI at the CMI
Bio-Layer Interferometry (BLI) is an optical technique for measuring macromolecular interactions by analyzing interference patterns of white light reflected from the surface of a biosensor tip. BLI experiments are used to determine the kinetics and affinity of molecular interactions. In a BLI experiment, one molecule is immobilized to a Dip and Read Biosensor and binding to a second molecule is measured. A change in the number of molecules bound to the end of the biosensor tip causes a shift in the interference pattern that is measured in real-time.
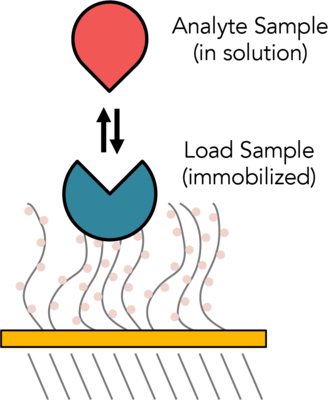


The CMI has two Sartorius (formerly ForteBio) instruments for measuring BLI: the Octet RED384 (now called Octet RH16) and the BLItz (now called Octet N1). The Octet RED384 is more sensitive and higher throughput and can be used for macromolecular and small molecule binding experiments. The BLItz uses a very small sample volume, but is more time consuming and cannot measure molecules smaller than 10 KDa.
ITC at the CMI
Isothermal Titration Calorimetry (ITC) is a label-free method for measuring binding of any two molecules that release or absorb heat upon binding. ITC can be used to measure the thermodynamic parameters of biomolecular interactions, including affinity (KA), enthalpy (ΔH), entropy (ΔS), and stoichiometry (n). Energetically favorable binding reactions have negative free energy values, ΔG = RTlnKD. ΔG, has two energetic components, enthalpy (ΔH) and entropy (ΔS) and their contributions are expressed as: ΔG = ΔH -TΔS. In an ITC experiment, ΔH of binding is measured directly. The microcalorimeter has two cells: one contains water and acts as a reference cell, the other contains the sample, into which a binding partner is titrated using an injection syringe. Heat sensing devices detect temperature differences between the cells when binding occurs in the sample cell and give feedback to the heaters, which compensate for this difference and return the cells to equal temperature.
Heats measured in an ITC are a combination of heats of binding and heats of dilution, so a control experiment to measure heats of binding must be performed. Therefore, one experiment includes two titrations:
- Component A (in the syringe) injected into component B (in the cell).
- Component A (in the syringe) injected into buffer (in the cell).
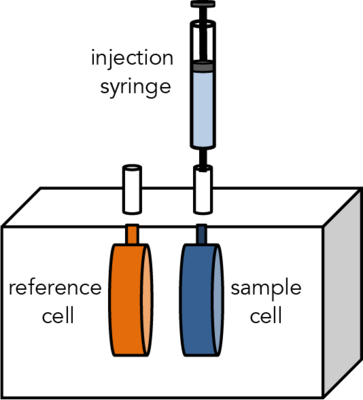
The CMI has a Microcal ITC200 from Malvern.
MST at the CMI
MicroScale Thermophoresis (MST) is an immobilization-free technology for measuring biomolecular interactions. The MST instrument detects the motion of fluorescent molecules along a microscopic temperature gradient, which reflects changes in the molecular hydration shell, charge, or size. Since one or all of these parameters will change with virtually every binding event, a wide range of biomolecules can be measured, from ions and small molecule fragments to large macromolecular complexes, in small volumes (~20 μl), in a wide range of standard buffers and complex mixtures such as liposomes, detergent, serum, and cell lysates.
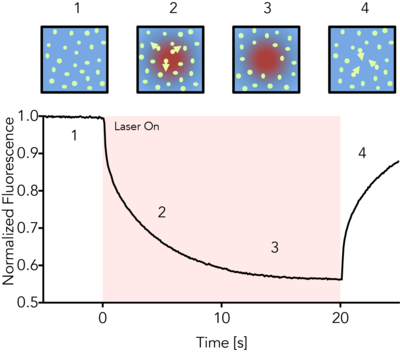
The CMI has a Monolith NT.115pico from NanoTemper Technologies.
SEC-MALS at the CMI
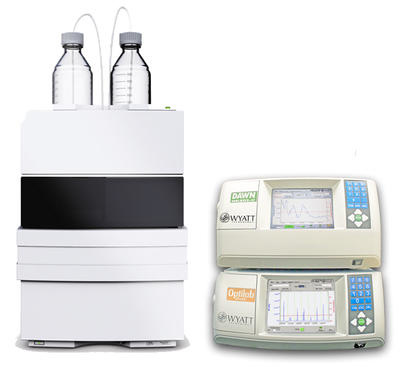
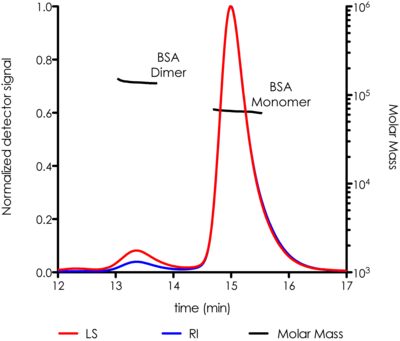
The CMI has a SEC-MALS system with a Wyatt Dawn Heleos Multi-Angle Light Scattering (MALS, 18-angle) Detector, with in-line DLS detector and Optilab TrEX refractive index detector. SEC-MALS is used to measure the weight-averaged molar mass of proteins (and other macromolecules) in solution, and can determine oligomeric state and sample polydispersity. Size-exclusion chromatography (SEC) separates molecules based on hydrodynamic volume, but is dependent on similarity to a set of reference standards for accurate mass determination and fails for elongated or sticky proteins. Multi-Angle Light static Scattering (MALS) is used to measure light scattering intensity accurately, which is proportional to the weight-averaged mass in solution. Combining SEC, MALS and concentration detectors in an SEC-MALS experiment allows for more accurate mass measurements that SEC or MALS alone.
By using two concentration detectors (RI and UV), the molar mass and weight-fraction of a modifier can be determined. This can be used to measure protein and modifier masses of integral membrane proteins in detergent micelles and of glycosylated proteins.
. 
DLS at the CMI
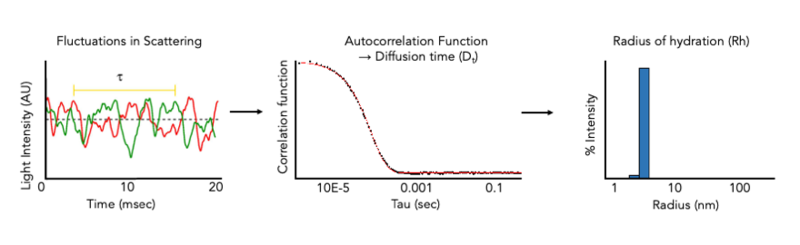
The CMI has Wyatt DynaPro Plate Reader III. The DynaPro Plate Reader III measures dynamic light scattering (DLS) and Static Light Scattering (SLS) at high-throughput on many sample types in standard microwell plates. and can be used to rapidly assess protein quality in solution. DLS measurements of hydrodynamic radius allow the monodispersity and aggregation state of a sample in solution to be measured in minutes and can be used to monitor protein quality during any (or all) stages of a protein purification project, or after storage. DLS can also be used to size a variety of nanoparticles, including liposomes, micelles, bicelles, and nanodiscs and for aggegation analysis of chemical compounds.

CD at the CMI
Circular Dichroism (CD) Spectroscopy is used to determine the optical isomerism and secondary structure of molecules. Circular dichroism (measured in molar ellipticity) is the difference in absorption of left-handed and right-handed circularly polarized light and can be observed in optically active molecules with chiral centers. Proteins have many chiral centers. CD spectra in the Far-UV region (185 – 250 nm) can be used to determine protein secondary structure. Characteristic peaks for Thermal stability (Tm) can be measured by following changes in molar ellipticity with increasing temperature.
The CMI has a Jasco J-1500 CD Spectropolarimeter with a Peltier temperature controller and single cuvette holder.
In April 2023, the Jasco J-815 was retired, after serving the BCMP department and HMS for almost 2 decades.
DSF at the CMI
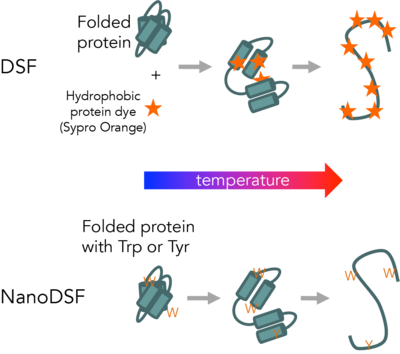
Differential Scanning Fluorimetry (DSF) measures protein unfolding by monitory changes in fluorescence as a function of temperature. Conventional DSF uses a hydrophobic fluorescent dye that binds to proteins as they unfold. NanoDSF measures changes in intrinsic protein fluorescence as proteins unfold.
The CMI has a modified Life Technologies Quant Studio 6/7, for conventional DSF. The CMI has the Life Technologies Protein Thermal Shift Analysis software for DSF data fitting.
The CMI has a Prometheus NT.Plex instrument from NanoTemper Technologies with aggregation optics. The CMI has these Data collection and analysis software packages: PR.ThermControl for thermal stability data collection, PR.ChemControl for chemical stability data collection, PR.TimeControl for time interval data collection, and PR.Stability Analysis for advanced data analysis.
SPR Resources
Cytiva Biacore Consumables Selection Guide, for a list of current consumables. Look for supplies compatible with the Biacore T200 and your sample types.
Purchase Sensor chips and reagents from Cytiva.
Supplies Provided by User:
- Cytiva Biacore Series S sensor chips
- running buffer (should include some detergent, such as 0.05% Tween 20)
-
all reagents and samples for immobilization and binding assays
- all concentrations of analyte sample should be in running buffer (with fixed concentation of all components, including DMSO, detergent, buffer and salt concentrations)
- pipettors for sample and reagent liquid handling
- (optional) 96-well and 384-well reagent plates and foil (foil must not have adhesive over wells, purchase from Cytiva)
Supplies provided by the CMI:
- plastic tubes and caps (3 sizes)
- instrument cleaning reagents: Desorb 1, Desorb 2, Biadisinfectant
- Purified water for instrument cleaning and running in Standby mode
CMI Biacore T200 SPR Getting Started Guide
Other Resources:
Biacore T200 Getting Started Handbook, an intro to SPR and tutorial, from Cytiva, formerly GE Healthcare.
Biacore Sensor Surface Handbook, a guide to SPR immobilization strategies, from Cytiva.
Biacore T200 Product Information from Cytiva.
Purchase Sensor chips and reagents from Cytiva.
SPR Pages, a good resource for all things SPR-related.
Additional Biacore T200 instrument and software manuals are available to users on the Biacore T200 computer.
BLI Resources
CMI OctetRED384 BLI Getting Started Guide
CMI OctetRED384 Guide to Epitope Binning
Bio-Layer Interferometry (BLI) Technology from Sartorius (formerly ForteBio)
Purchase BLI Dip and Read sensors from Sartorius (formerly ForteBio)
CMI BLItz Getting Started Guide
BLItz User Guide from ForteBio
Bio-Layer Interferometry (BLI) Technology page from ForteBio
BLItz Product Information from ForteBio
Purchase BLI Dip and Read sensors from ForteBio
Octet RED 384 Supplies
User-Provided Required supplies:
- Sartorius (formerly ForteBio) Dip and Read sensors
- Black 96-well plate to soak sensors
- Black 96-well or 384-well plate for samples and reagents
- Pipettors for sample handling
Optional provided supplies and equipement:
- Empty BLI Sensor trays to use as working tray during experiment
- 8-sensor transfer tool
- Refrigerated centrifuge with microplate rotor
BLItz Supplies
User-Provide Required supplies:
- Sartorius (formerly ForteBio) Dip and Read sensors
- 96-well plate to soak sensors
CMI-Provide Required Supplies:
- Black 0.5 ml tubes (provided by CMI)
| Popular Dip and Read Biosensors for Kinetics* | Part Number |
| Streptavidin (SA) biosensors | 18-5019 (96/tray) |
| High Precision Streptavidin (SAX) biosensors | 18-5117 |
| Super-Streptavidin (SSA) biosensors (for small molecules) | 18-5057 |
| anti-His (HIS1K) biosensors | 18-5120 |
| Ni-NTA (NTA) biosensors | 18-5101 |
| Anti-Human IgG Fc biosensors | 18-5010 |
* See Sartorius (formerly ForteBio) BLI website for more sensor types
| OCTET Black Microplates** | Part Number |
| Greiner Bio-One 96-well black flat-bottom PP, 200 µL | 655209 (VWR 82050-784) |
| Greiner Bio-One 384-well black flat-bottom PP, 80-120 µL | 781209 (VWR 82051-318) |
| ForteBio 384-well black tilted-bottom PP, 60 µL | 18-5080 |
** Only Greiner Bio-One brand, black microplates or Sartorius (formerly ForteBio) plates are recommended by Sartorius for the Octet sample and reagent plate.
ITC Resources
CMI ITC200 Getting Started Guide, general guidelines for sample preparation and standard protocol
MicroCal ITC200 Getting Started Handbook
MicroCal ITC200 User Manual
Supplies provided by the CMI:
- tubes for syringe filling
- water and methanol for instrument cleaning
Assay Buffers
- The two binding partners must be in identical buffers to minimize heats of dilution which can mask heats of binding.
- Additional buffer (matched to samples) is required for baselines, dilutions and rinsing the cell.
- DMSO has high heats of dilution and should be matched extremely well between the cell and the syringe.
- Small differences in pH will cause high heats of dilution.
- Reducing agents can cause erratic baseline drift and artifacts. TCEP is recommended over βMe and DTT. Avoid or keep ≤ 1 mM, especially if ΔH is small.
- Using degassed buffers will reduce the introduction of air bubbles and improve results.
Samples
-
Required volumes for one experiment:
- ≥ 300 µL protein for sample cell (202 µL + ~ 80-90 µL for filling).
- ≥ 100-120 µL ligand for syringe (40 µl syringe + 20 µl for filling, for each injection)
-
typical starting concentrations:
- 5-50 µM in the cell (at least 10x Kd)
-
50-500 µM in the syringe (≥10x concentration in cell for 1:1 stoichiometry
- Aim for a c value between 10-100 for optimal fit
-
Molar concentration should be accurately measured.
- Errors in Cell concentration affect stoichiometry.
- Errors in the Syringe concentration will directly translate to errors in the KD, and affect ΔH and n.
-
Protein aggregates will interfere with ITC.
- Centrifuge or filter samples before use.
- Assess protein heterogeneity via light scattering.
- Purify protein samples with soluble aggregates by size-exclusion chromatography.
MST Resources
CMI Monolith MST Getting Started Guide
MicroScale Thermophoresis technology, from NanoTemper Technologies
Monolith NT.115 instrument product page, from NanoTemper Technologies
Required Supplies
- fluorescent target sample and non-fluorescent ligand sample and matched buffer
- MST capillaries (see below)
- 0.2 ml tubes for sample preparation (provided by CMI)
- pipetors and tips for liquid handing
NanoTemper Supplies
MST Capillaries
- Monolith NT.115 Standard Treated Capillaries, MO-K022 (available from the CMI, at cost)
- Monolith NT.115 MST Premium Coated Capillaries, MO-K025 (available from the CMI, at cost)
Labeling Kits (optional)
- NanoTemper Protein Labeling Kit RED-NHS 2nd Generation (Amine Reactive), MO-L011
- NanoTemper Protein Labeling Kit RED-MALEIMIDE 2nd Generation (Cys Reactive). MO-L014
- NanoTemper His-Tag Labeling Kit RED-tris-NTA 2nd Generation, MO-L018
Assay Buffers
- Many buffers are compatible with MST. It’s usually a good idea to start with a buffer system in which your proteins are well behaved.
- Addition of 0.05% Tween 20 or other detergent is usually required to prevent sticking of proteins to the capillaries.
- Each capillary should be prepared with identically matched buffer.
- Assay buffer (with detergent) is used to dilute the fluorescent molecule to 2X.
- Ligand buffer is used to dilute the ligand and should match the highest concentration of ligand
- 0.5-1 mg/ml BSA can also be used to minimize non-specific binding.
- Buffer cannot be opaque.
- High viscosity samples may be hard to fill (up to 10% glycerol is fine).
Samples
- All MST experiments are setup with one fluorescently-labeled molecule (the Target) at a fixed concentration mixed with various concentrations of a non-fluorescent molecule (the Ligand).
-
Concentration should be accurately measured
- Errors in Target concentration can affect fluorescent signal and may affect the fit
- Errors in the Ligand concentration will directly translate to errors in the KD
-
Protein aggregates will interfere with MST
- Filter or centrifuge samples before use.
- Assess protein heterogeneity via light scattering.
- Purify protein samples with soluble aggregates by size-exclusion chromatography.
Target Sample (the fluorescent molecule)
- ~200 µL/titration at >2X working concentration
- 5-20 µM unlabeled protein, if using a chemical labeling kit
-
RED detector:
- Stock concentration of labeled Target: > 10 nM
- Recommended working concentration: 5 nM (for KD > nM)
- Minimal working concentration: ≥ 50 pM (used for KD in pM range)
-
BLUE detector:
- Stock concentration of labeled Target: > 20 nM
- Recommended working concentration: 20 nM
- Minimal working concentration: ≥ 5 nM
Ligand Sample (the non-fluorescent binding partner)
- ~ 20 µL/titration, at 2X working concentration (bring the highest stock concentration available for an unknown KD)
- Recommended stock concentration ≥ 100X the expected KD
- Recommended working concentration ≥ 50X KD
CD Resources
CMI Resources
CMI Jasco J-1500 CD Getting Started Guide, guide to experimental design and standard Far-UV CD protocols.
Additional resources are available at the instrument. Instrument and software manuals are located in the “Jasco Manuals” desktop folder on the instrument computer.
Additional Resources
Jasco Training Videos provide more information on various topics related to CD measurements and the Spectra Manager program.
DichroWeb, a free online tool for determining protein secondary structures based on CD spectra.
- Academic users may apply for a username and password.
CDToolX, a free, downloadable software program that enables processing, displaying, archiving, calibrating, comparisons, and analyses of circular dichroism (CD) spectroscopic data.
Protein Circular Dichroism Data Bank, a database of CD data
- The YouTube channel provides video tutorials on a variety of CD-related topics, including the successful measurement of a CD spectrum and analysis using DichroWeb and CDToolX.
BeStSel (Beta Structure Selection), a free online tool based on a novel method for the secondary structure determination and fold recognition from protein circular dichroism spectra, especially beta-sheet rich proteins.
ValiDichro tests the quality of CD data based on based on common characteristics of CD protein spectra observed in the literature.
*J-815 RETIRED APRIL 2023 - CMI Jasco J-815 CD Getting Started Guide. Replaced with newer J-1500 instrument.
-
High Quality Quartz cuvette
-
1 mm pathlength cuvette
- Hellma 110-1-40, style 110-QS (available from Sigma-Aldrich)
- Starna 21-Q-1
-
1 cm pathlength cuvette
- Hellma 100-10-40, style 100-QS (available from Sigma-Aldrich)
- Starna 1-Q-10 or 21-Q-10
-
1 mm pathlength cuvette
- your sample
- buffer blank
For Far-UV measurements (protein secondary structure): 1 mm
For Near-UV measurements: 1 cm or 1 mm, depending on application and concentration
Assay Buffers
Buffer selection is critical for accurate CD measurements. Solvent absorbance can severely interfere with the CD signal. Many commonly used buffers and additives absorb in the far UV region used for CD measurements.
-
The ideal CD experiment is performed in a buffer:
- in which your protein is well behaved and soluble
- with no buffer absorbance through the range of the CD spectrum.
-
Always take a scan of your buffer blank to determine whether absorbance interferes with your region of analysis.
- Ensure that the buffer blank is well matched to the final dilution of your protein (even trace amounts of some solvents will interfere with the CD measurements).
- Phosphate buffers with little-to-no NaCl are recommended. 10 mM phosphate buffer is ideal.
-
Ideal aqueous solutions contain as little chloride as possible.
- NaCl and Tris buffers are not recommended but can be tolerated at low concentrations.
- If salt is required, SO42- or F- are preferred counter ions, as they are transparent in the far UV. Potassium fluoride may be a good substitute for chloride-containing salts.
- Chloride ions will result in a loss of signal below about 200±5 nm, which affects secondary structure estimation, but generally will not block detection of the alpha-helical peaks (208 nm and 222 nm) or the beta-sheet peak (218 nm).
- DTT, ß-ME, or EDTA can be present at low concentrations (1 mM).
- Some detergents are fairly transparent in the far UV (e.g. Chaps and octylglucoside). Triton detergents should be avoided, as they can oxidize readily and form UV-absorbing materials.
- DMSO, formamides, and imidazole absorb strongly in the far UV region, and thus should be avoided in a CD experiment.
Samples
-
An accurate protein concentration is required for all CD experiments.
- Over-estimating or under-estimating the protein concentration interferes with signal
- Algorithms that estimate secondary structure depend on correct protein concentrations
- The amount of sample required for a CD experiment depends on the size, cuvette pathlength and type of measurement being performed.
- 1 mm pathlength cuvettes holds 300 µl and a 1 cm cuvette holds 3 ml.
- Required protein concentration is inversely proportional to the cuvette pathlength, and thus a 1 mm path cuvette requires 10x the concentration of a 1 cm cuvette.
-
Recommended concentrations for Far-UV measurements of protein secondary structure are (Jasco J-1500):
- 0.1 mg/mL in 1 mm path cuvette
- 0.01 mg/mL in 10 mm patch cuvette
- Mol/L=115/(MW*7000)*10/pathlength(mm).
- If possible, make a concentrated stock solution of your protein (at least 2X) and dilute as needed. Protein requirements vary with secondary structure, as alpha-helical proteins have a stronger signal than beta-sheet proteins.
-
Protein aggregates can interfere with the CD signal.
- Assess protein heterogeneity via light scattering.
- Purify protein samples with soluble aggregates by size-exclusion chromatography.
- Samples can be recovered from the cell. This is not recommended for thermal melts, unless you know your thermal denaturation is reversible.
DSF and NanoDSF Resources
NanoDSF Resources
NanoDSF Resources
NanoDSF Supplies
-
NT.Plex Capillary Chips
- 2x 8 Standard 24-Capillary Chips, NanoTemper Catalog # PR-AC002
-
2x 8 High Sensitivity 24-Capillary Chips, NanoTemper Catalog # PR-AC006
- 384-well plates for loading capillaries
- Protein samples, ligands, buffers
DSF Resources
CMI QuantStudio DSF Getting Started Guide
Protein Thermal Shift Studies manual from Applied Biosystems by Life Technologies
All Experiments:
- 96-well FAST-block optical plate, eg.: LifeTechnologies MicroAmp FAST optical 96-well reaction plate, 0.1 ml, 4346907
- optical adhesive film, eg.: LifeTechnologies MicroAmp Optical Adhesive Film, 4360954
DSF/Protein Thermal Shift Experiments
- DSF compatible dye, eg.: LifeTechnologies Protein Thermal Shift Dye Kit, 4461146 (Sypro Orange)
- samples, ligands, buffers
qPCR Experiments
- qPCR reagents (eg. LifeTechnologies PowerUp SYBR Green Master Mix, A25742)
- primers and templates
qPCR Resources
CMI QuantStudio qPCR Getting Started Guide
Quant Studio 6/7 Quick Reference Guide from Applied Biosystems by Life Technologies
Light Scattering Resources
SEC-MALS Resources
Generally, SEC-MALS data collection is done in ASTRA 7 with HPLC control.
CMI SEC-MALS Getting Started Guide
CMI SEC-MALS Guide to Protein Conjugate Analysis, guide to measuring dn/dc values and performing protein conjugate data analysis.
CMI SEC-MALS Guide to Working with Custom Solvents, for solvents that cannot use PBS or water as the solvent model.
SEC-MALS Technology page from Wyatt Technologies.
- purified protein samples (must be filtered before loading)
- running buffer (1L)
- analytical SEC column (the CMI usually has 1-2 working SEC-MALS columns that users may borrow, if their samples are purified by SEC and in an appropriate buffer)
Assay Buffers
- Running buffer should always be chosen to be compatible with both the SEC column and the protein sample.
- Recommended Buffer: 25 mM HEPES pH 7-7.5, 150 mM NaCl (filtered).
-
Make sure you know the buffer compatibility of the SEC column you are using.
- Most silica columns will not tolerate pH above 7.5.
- Some buffer components (e.g. glycerol) will require customization of the solvent profile. Take note of the absolute refractive index of the solvent after equilibration and before data collection.
Samples
-
The sample should be prepared in running buffer to minimize RI peak due to sample solvent.
- This is particularly important for samples that run near the solvent peak.
- It is good practice to run a size-exclusion chromatography purification prior to analytical SEC-MALS to buffer exchange and clear aggregates. This is a requirement if you are using a shared CMI column.
- Samples must be filtered or centrifuged prior to injection.
-
Concentration should be accurately measured to assess column recovery.
- Know the concentration (in mg/ml) of your protein.
- Know the UV extinction coefficient (in ml/mg•cm) of your protein
-
Protein aggregates can damage the column.
- Filter or centrifuge samples before use.
- Assess protein heterogeneity via dynamic light scattering (in the DynaPro plate reader).
- Purify protein samples with soluble aggregates by size-exclusion chromatography.
-
Recommended protein concentration varies depending on protein mass:
-
Scattering is proportional to mass
- Larger proteins require less sample than smaller proteins.
-
Typical range 5 – 500 µg/injection
- BSA (67 KDa) 100 µl at 2 mg/ml always gives a good light scattering signal
-
Scattering is proportional to mass
-
Sample volume:
- Maximum injection volume: 100 µl
- Minimum injection volume: 5 µl
-
Glass autosampler vial with low volume insert has 10 µl dead volume.
- Fill vial with at least 110 µl for a 100 µl injection.
DLS Resources
DLS Resources
CMI DynaPro DLS Getting Started Guide, guide to DynaPro Plate Reader III.
CMI Dynapro SLS Getting Started Guide, guide to DLS with static light scattering measurements.
Tips for evaluating correlation function, adapted from DYNAMICS User’s Guide (M1406 Rev. F).
DLS Technology page from Wyatt Technologies.
DLS Supplies
0.02 μm filters for sample preparation, eg. Whatman Anatop 10, 0.02 μm, 10 mm inner diameter, Part Number 6809-1002
Clear-bottom Black Microplates:
| number of wells | 384 | 384 | 96 |
| Manufacturer | Aurora Microplates | Greiner Bio-One | Greiner Bio-One |
| Part Number | ABM2‐10100A | 781 892 | 655 892 |
| base material | 188 μm film | glass | glass |
| Minumum Volume | 25 μl | 50 μl | 100 μl |
| Temperature Range | 20-85 C | 20-37 C | 20-37 C |
| SLS Compatible | yes | yes | yes |
| Recommended For |
high temperature/ thermal stability |
Room Temp | Room Temp |
Assay Buffers
- DLS is compatible with a range of buffers
- Use filtered buffers
-
Measure scattering of buffer control
- Detergents frequently have micelle size similar to that of proteins and scatter significantly
Samples
-
DLS is very sensitive to small amounts of aggregates.
- Significant aggregates will make accurate size measurements difficult.
- Samples should be filtered or centrifuged (6000g, 10-30 min) prior to transfer to the clear bottom plate to remove large aggregates and precipitates.
-
The minimum amount of sample required depends on the size of the molecule, as large molecules scatter more light than small molecules.
- For most protein samples, concentrations of 0.2 mg/ml or higher are recommended.
- As little as 0.125 mg/ml of lysozyme or 12.5 μg/ml of IgG can be detected.
-
Small molecule aggregation analysis should be done at working concentrations in and working solvents (e.g. 5% DMSO).
- Solvent controls are essential. DMSO itself is prone to aggregation.
-
When working with membrane proteins, note that empty detergent micelles will not resolve from protein-filled micelles (except when empty micelle varies in size by 5-10X)
- Avoid excess detergent by purifying membrane proteins by affinity and/or size-exclusion chromatography and avoid concentrating after purification
About Nanobodies
The majority of antibodies used in the laboratory are of mammalian origin and have a conventional bivalent architecture consisting of two heavy chains and two light chains. The heavy and light chains have terminal variable domains responsible for antigen specificity, VHand VL. While camelids also produce conventional antibodies, the majority of circulating antibodies have a different architecture, consisting only of two heavy chains, called heavy chain antibodies.1 The smaller variable domains of camelid antibodies (VHH domains), also called nanobodies, allow them to bind in clefts of folded proteins that are not accessible by larger heterodimeric Fab and single-chain variable domain (scFv) fragments. Nanobodies have been particularly useful as tools to facilitate structural studies and to modulate function of many proteins including integral membrane receptors.2 Unlike conventional antibodies or antibody fragments which have multiple obligate interchain and intrachain disulfide bonds, the camelid VHH domain framework (which can have up to two disulfides), generally retains function in the reducing environment of the cytoplasm. Combined with their small size, this makes nanobodies particularly useful tools for intracellular applications such as super-resolution live-cell imaging.3,4 In addition to being useful laboratory tools, nanobodies are plausible scaffolds for drug development. Nanobody scaffolds have been humanized5 and the first nanobody drug (Caplacizumab) was approved by the FDA.6

While camelid heavy chain antibodies can be produced by immunization of camels, llamas or alpacas, the process requires a large animal husbandry facility and is time consuming and expensive. The Kruse lab has developed a synthetic yeast display library based on a consensus framework derived from llama antibody genes with variable complementary determining region loops (CDRs) designed from known nanobody structures.7 The CMI antibody discovery platform currently offers nanobody production services based on this unique HMS resource.
Antibodies derived using surface display technologies, such as yeast display, offer several unique features rarely accessible by animal immunization.8 The most practical advantage of surface display technologies is that antibody fragments are sequence-verified and renewable, allowing for rapid subcloning into a variety of expression systems for production in many formats. Specificity can be expanded or restricted by including secondary or counter screens with additional antigens. In vitro selection methods have been used to achieve selective recognition of chemical modifications and proteins with single surface-exposed amino acid differences, where conventional immunization has failed. In vitro selection methods avoid immunological tolerance, which can restrict the production of antibodies produced in mammals against highly conserved antigenic targets. Affinity maturation to improve affinity or selectivity, by generation of secondary libraries of mutagenized variants, can be performed at any stage using the same selection process. Surface display methods can also be used to directly select human antibody frameworks, avoiding the need to humanize animal frameworks for conversion to biologics.
- Hamers-Casterman, C. et al.Naturally occurring antibodies devoid of light chains. Nature363,446–448 (1993).
- Manglik, A., Kobilka, B. K. & Steyaert, J. Nanobodies to Study G Protein-Coupled Receptor Structure and Function. Annu. Rev. Pharmacol. Toxicol.57,19–37 (2017).
- Pleiner, T. et al.Nanobodies: site-specific labeling for super-resolution imaging, rapid epitope-mapping and native protein complex isolation. Elife4,e11349 (2015).
- Schumacher, D., Helma, J., Schneider, A. F. L., Leonhardt, H. & Hackenberger, C. P. R. Nanobodies: Chemical Functionalization Strategies and Intracellular Applications. Angew. Chem. Int. Ed. Engl.57,2314–2333 (2018).
- Vincke, C. et al.General strategy to humanize a camelid single-domain antibody and identification of a universal humanized nanobody scaffold. J Biol Chem284,3273–3284 (2009).
- Kaplon, H. & Reichert, J. M. Antibodies to watch in 2019. MAbs11,219–238 (2019).
- McMahon, C. et al.Yeast surface display platform for rapid discovery of conformationally selective nanobodies. Nat Struct Mol Biol25,289–296 (2018).
- Bradbury, A. R. M., Sidhu, S., Dübel, S. & McCafferty, J. Beyond natural antibodies: the power of in vitro display technologies. Nat Biotechnol29,245–254 (2011).
- Wörn, A. & Pluckthun, A. Stability engineering of antibody single-chain Fv fragments. J Mol Biol305,989–1010 (2001).