For information on access fees, policies and getting started at the CMI, see the CMI Access Page.
Isothermal Titration Calorimetry (ITC)
ITC at the CMI
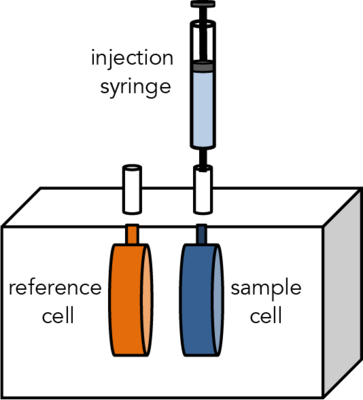
Isothermal Titration Calorimetry (ITC) is a label-free method for measuring binding of any two molecules that release or absorb heat upon binding. ITC can be used to measure the thermodynamic parameters of biomolecular interactions, including affinity (KA), enthalpy (ΔH), entropy (ΔS), and stoichiometry (n). Energetically favorable binding reactions have negative free energy values, ΔG = RTlnKD. ΔG, has two energetic components, enthalpy (ΔH) and entropy (ΔS) and their contributions are expressed as: ΔG = ΔH -TΔS. In an ITC experiment, ΔH of binding is measured directly. The microcalorimeter has two cells: one contains water and acts as a reference cell, the other contains the sample, into which a binding partner is titrated using an injection syringe. Heat sensing devices detect temperature differences between the cells when binding occurs in the sample cell and give feedback to the heaters, which compensate for this difference and return the cells to equal temperature.
Heats measured in an ITC are a combination of heats of binding and heats of dilution, so a control experiment to measure heats of binding must be performed. Therefore, one experiment includes two titrations:
- Component A (in the syringe) injected into component B (in the cell).
- Component A (in the syringe) injected into buffer (in the cell).

The CMI has a Microcal ITC200 from Malvern.
C Value
An important equation to consider when planning and optimizing an ITC experiment is the c value.
c = n•[M]cell/KD
n = stoichiometry
[M]cell=concentration in the cell
KD = dissociation constant
The c values determines the shape of your data. Ideally, the c value is between 10-100. Values of c that are too low (<10) can sometimes be used to fit KD, but can't be used to accurately deterimine stoichiometry. Values of c > 1000 can be used to accurately determine n, but not KD.
Concentrations should be chosen such that sufficient heat is produced (typically > 5 μM for protein in the cell) and such that c value is in the ideal range.
Key Features
Applications
- Equilibrium binding: KA, KD
- Stoichiometry of binding: n
- Macromolecular and small molecule binding
Key Features
- Truly modification-free (no labels or immobilization)
- No size limits
- Can gain insights into the mechanism of binding
- No consumables to purchase
ITC Theory and Data Collection
Energetically favorable binding reactions have negative free energy values, ΔG = RTlnKD. ΔG, has two energetic components, enthalpy (ΔH) and entropy (ΔS) and their contributions are expressed as:
ΔG = ΔH -TΔS.
In an ITC experiment, ΔH of binding is measured directly. The ITC200 microcalorimeter has two cells: one contains water and acts as a reference cell, the other contains the sample. The microcalorimeter needs to keep these two cells at exactly the same temperature during the course of an experiment. Heat sensing devices detect temperature difference between the cells when binding occurs in the sample cell and give feedback to the heaters, which compensate for this difference and return the cells to equal temperature.
Data collection
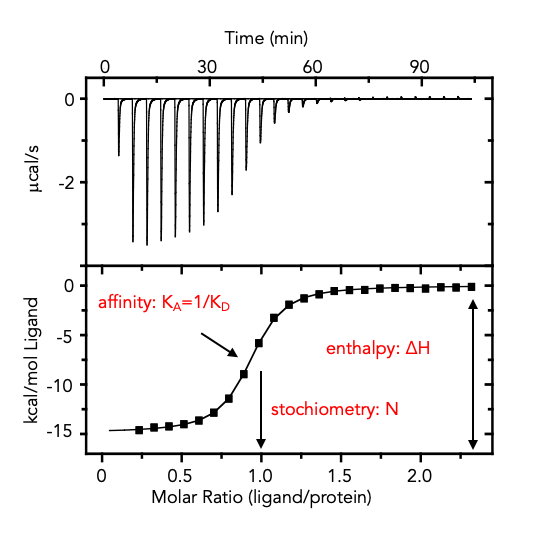
To perform an experiment, the calorimeter is set to the experimental temperature. The sample cell is filled and the injection syringe is loaded with ligand. The syringe is inserted into the sample cell and and a series of small aliquots of ligand are injected into the sample solution, while stirring. If there is a binding of the ligand to the sample, heat changes of a few millionths of a degree Celsius are detected and measured. The microcalorimeter measures all heat released until the binding reaction has reached equilibrium. The instrument records the differential power (in µcal/sec) applied to the sample cell vs. the reference cell to keep the two cells at the same temperature.
Results
The example below shows an exothermic reaction, which means the sample cell becomes warmer than the reference cell and causes a downward peak in the signal. As the temperature of the two cells equilibrate, the signal returns to its starting position. As the molar ratio between the ligand and sample increases, the sample becomes saturated and fewer injected ligand molecules bind and the heat change decreases. By integrating the area of the injection peaks and plotting molar ratio vs. ∆H (kcal/mol), an ITC binding curve can be fit for binding affinity (KA = 1/KD), reaction stoichiometry (n), enthalpy (∆H) and entropy (ΔS). The relative contribution of enthalpy and entropy to the binding energetics can provide insights into molecular mechanism: ∆H is an indication of changes in hydrogen bonding and van der Waals interactions, and ∆S is an indication of changes in hydrophobic effects and conformational changes.

Data Files - About CMI Data Files
Users are responsible for storage of all raw and processed data collected at the CMI.
- Users should have a plan to copy or transfer all raw and process data to their own local or cloud storage system.
- While the CMI allows temporary local storage of CMI User data on the instrument computer, we make no guarantees on the security or long-term availability of any data at the CMI.
- For most (but not all) CMI technologies, the raw data files and recommended readable exports are relatively small and can be readily transferred electronically.
- See specific instruments for exceptions and for details about the software, data file types and recommended data exports.
Data Sharing:
- Currently, a Generalist Repository is the recommended data repository for most CMI data types, as stable specialist data repositories have not been established.
Data Files - ITC - ITC200
| Technology | Isothermal Titration Calorimetry (ITC) | ||
| Instrument | Microcal ITC200 | ||
| Recommended Repository | Generalist Repository | ||
| Software Type | Data Collection | ||
| Current Version | MicroCal iTC200, Version 1.30.0 | ||
| Data Files (Type, ~size) | experiment file (readable text file) | .itc | 250 KB/measurement |
| Software Type | Data Analysis | ||
| Current Version | Origin 7 (MicroCal Analysis Module), Version 7.0552 | ||
| Data Files (Type, ~size) | analysis file | .opj | 350 KB/file |
| Readable Exports | graph image | .jpg | 200 KB |
CMI ITC200 Getting Started Guide, general guidelines for sample preparation and standard protocol
MicroCal ITC200 Getting Started Handbook
MicroCal ITC200 User Manual
Supplies provided by the CMI:
- tubes for syringe filling
- water and methanol for instrument cleaning
Assay Buffers
- The two binding partners must be in identical buffers to minimize heats of dilution which can mask heats of binding.
- Additional buffer (matched to samples) is required for baselines, dilutions and rinsing the cell.
- DMSO has high heats of dilution and should be matched extremely well between the cell and the syringe.
- Small differences in pH will cause high heats of dilution.
- Reducing agents can cause erratic baseline drift and artifacts. TCEP is recommended over βMe and DTT. Avoid or keep ≤ 1 mM, especially if ΔH is small.
- Using degassed buffers will reduce the introduction of air bubbles and improve results.
Samples
-
Required volumes for one experiment:
- ≥ 300 µL protein for sample cell (202 µL + ~ 80-90 µL for filling).
- ≥ 100-120 µL ligand for syringe (40 µl syringe + 20 µl for filling, for each injection)
-
typical starting concentrations:
- 5-50 µM in the cell (at least 10x Kd)
-
50-500 µM in the syringe (≥10x concentration in cell for 1:1 stoichiometry
- Aim for a c value between 10-100 for optimal fit
-
Molar concentration should be accurately measured.
- Errors in Cell concentration affect stoichiometry.
- Errors in the Syringe concentration will directly translate to errors in the KD, and affect ΔH and n.
-
Protein aggregates will interfere with ITC.
- Centrifuge or filter samples before use.
- Assess protein heterogeneity via light scattering.
- Purify protein samples with soluble aggregates by size-exclusion chromatography.
